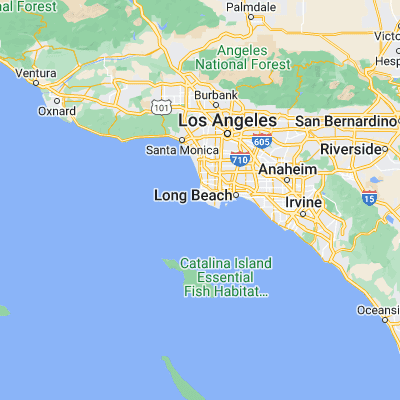
Rancho Palos Verdes Water Temperature
(Today) 2025
The water will feel medium. The water will feel a bit chilly in just bathers / swimming costume. If you plan on wearing a wetsuit 4/3mm should be thick enough.
Current weather
(clear sky)

The measurements for the water temperature in Rancho Palos Verdes, California are provided by the daily satellite readings provided by the NOAA. The temperatures given are the sea surface temperature (SST) which is most relevant to recreational users.
*Live data may vary from satellite readings for a number of reasons. These include local factors, depth of smapling and time of day.
Water temp by month
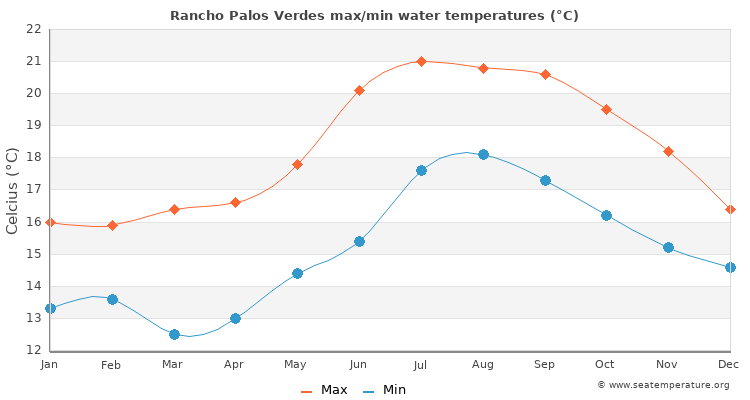
Monthly average max / min water temperatures
The graph below shows the range of monthly Rancho Palos Verdes water temperature derived from many years of historical sea surface temperature data.
| Jan | Feb | Mar | Apr | May | Jun | Jul | Aug | Sep | Oct | Nov | Dec | |
|---|---|---|---|---|---|---|---|---|---|---|---|---|
| Min °C | 13.3 | 13.6 | 12.5 | 13 | 14.4 | 15.4 | 17.6 | 18.1 | 17.3 | 16.2 | 15.2 | 14.6 |
| Max °C | 16 | 15.9 | 16.4 | 16.6 | 17.8 | 20.1 | 21 | 20.8 | 20.6 | 19.5 | 18.2 | 16.4 |
| Min °F | 57 | 57.4 | 56 | 56.8 | 59.3 | 61.6 | 65 | 65.6 | 64.4 | 62.4 | 60.6 | 59 |
| Max °F | 59.7 | 59.7 | 59.9 | 60.4 | 62.7 | 66.3 | 68.4 | 68.3 | 67.7 | 65.7 | 63.6 | 60.8 |
The warmest water temperature is in August with an average around 66.9°F / 19.4°C. The coldest month is March with an average water temperature of 57.9°F / 14.4°C.
7 day tide forecast for Rancho Palos Verdes
| Thu | Fri | Sat | Sun | Mon | Tue | Wed |
|---|---|---|---|---|---|---|
|
|
|
|
|
|
|
*These tide times are estimates based on the nearest accurate location (Los Angeles Harbor, Mormon Island, California) and may differ by up to half an hour depending on distance. Please note, the tide times given are not suitable for navigational purposes.