North River Shores Water Temperature
(Today) 2025
The water will feel warm (balmy). Most people will be OK with just bathers / swimming costume at this temperature. If you intend to stay in the water for a while a thin shorty wetsuit will suffice.
*Live data from Fort Pierce, FL (134): 23.9°C / 75°F
Current weather
(scattered clouds)

The measurements for the water temperature in North River Shores, Florida are provided by the daily satellite readings provided by the NOAA. The temperatures given are the sea surface temperature (SST) which is most relevant to recreational users.
*Live data may vary from satellite readings for a number of reasons. These include local factors, depth of smapling and time of day.
Water temp by month
Monthly average max / min water temperatures
The graph below shows the range of monthly North River Shores water temperature derived from many years of historical sea surface temperature data.
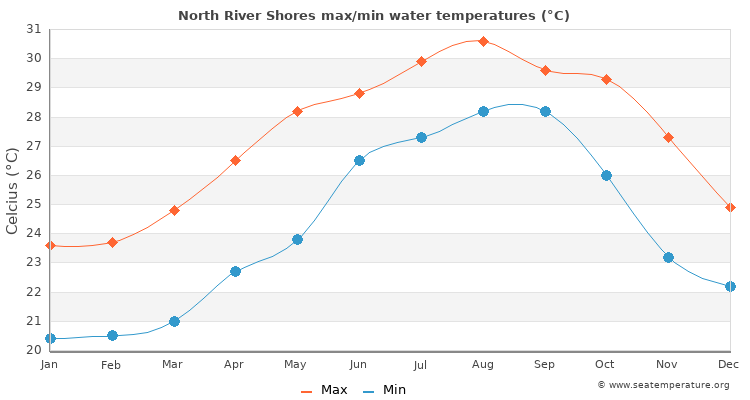
| Jan | Feb | Mar | Apr | May | Jun | Jul | Aug | Sep | Oct | Nov | Dec | |
|---|---|---|---|---|---|---|---|---|---|---|---|---|
| Min °C | 20.4 | 20.5 | 21 | 22.7 | 23.8 | 26.5 | 27.3 | 28.2 | 28.2 | 26 | 23.2 | 22.2 |
| Max °C | 23.6 | 23.7 | 24.8 | 26.5 | 28.2 | 28.8 | 29.9 | 30.6 | 29.6 | 29.3 | 27.3 | 24.9 |
| Min °F | 70 | 70.2 | 71.3 | 74.4 | 76.6 | 80.6 | 82.2 | 83.7 | 83.3 | 80.1 | 75.4 | 73 |
| Max °F | 73.2 | 73.4 | 75.1 | 78.2 | 81 | 82.9 | 84.8 | 86.1 | 84.7 | 83.4 | 79.5 | 75.7 |
The warmest water temperature is in August with an average around 84.9°F / 29.4°C. The coldest month is January with an average water temperature of 71.6°F / 22.0°C.
7 day tide forecast for North River Shores
| Mon | Tue | Wed | Thu | Fri | Sat | Sun |
|---|---|---|---|---|---|---|
|
|
|
|
|
|
|
*These tide times are estimates based on the nearest accurate location (Stuart, St. Lucie River, Florida) and may differ by up to half an hour depending on distance. Please note, the tide times given are not suitable for navigational purposes.