Québec Water Temperature
(Today) 2026
The water will feel freezing / baltic. You would have to be insane or getting paid to want to get in water this cold! If you do make sure you are wearing a top end drysuit and all the accessories.
Current weather
(overcast clouds)

The measurements for the water temperature in Québec, Quebec are provided by the daily satellite readings provided by the NOAA. The temperatures given are the sea surface temperature (SST) which is most relevant to recreational users.
*Live data may vary from satellite readings for a number of reasons. These include local factors, depth of smapling and time of day.
Water temp by month
Monthly average max / min water temperatures
The graph below shows the range of monthly Québec water temperature derived from many years of historical sea surface temperature data.
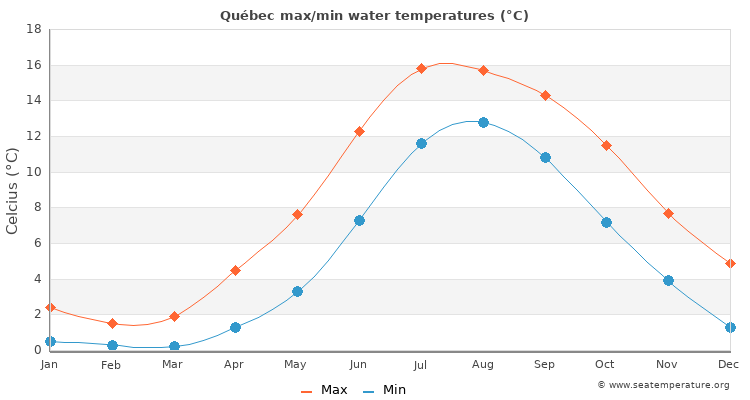
| Jan | Feb | Mar | Apr | May | Jun | Jul | Aug | Sep | Oct | Nov | Dec | |
|---|---|---|---|---|---|---|---|---|---|---|---|---|
| Min °C | 0.5 | 0.3 | 0.2 | 1.3 | 3.3 | 7.3 | 11.6 | 12.8 | 10.8 | 7.2 | 3.9 | 1.3 |
| Max °C | 2.4 | 1.5 | 1.9 | 4.5 | 7.6 | 12.3 | 15.8 | 15.7 | 14.3 | 11.5 | 7.7 | 4.9 |
| Min °F | 33.6 | 33 | 33 | 35.6 | 39.6 | 47.1 | 54.6 | 56.2 | 52.8 | 46.6 | 40.5 | 35.8 |
| Max °F | 35.5 | 34.2 | 34.7 | 38.8 | 43.9 | 52.1 | 58.8 | 59.1 | 56.3 | 50.9 | 44.3 | 39.4 |
The warmest water temperature is in August with an average around 57.6°F / 14.2°C. The coldest month is February with an average water temperature of 33.6°F / 0.9°C.
7 day tide forecast for Québec
| Wed | Thu | Fri | Sat | Sun | Mon | Tue |
|---|---|---|---|---|---|---|
|
|
|
|
|
|
|
*These tide times are estimates based on the nearest accurate location (Bassin De La Rivière St-Charles, Québec) and may differ by up to half an hour depending on distance. Please note, the tide times given are not suitable for navigational purposes.