North Sunderland Sea Temperature
(Today) 2025
The water will feel cold. All but the most ardent watersports enthusiasts will be thinking of packing up for the winter. If not we'd suggest a thick 5/4mm wetsuit along with some boots and a hood.
*Live data from Newbiggin: 9.7°C / 49.5°F
Current weather
(overcast clouds)

The measurements for the water temperature in North Sunderland, England are provided by the daily satellite readings provided by the NOAA. The temperatures given are the sea surface temperature (SST) which is most relevant to recreational users.
*Live data may vary from satellite readings for a number of reasons. These include local factors, depth of smapling and time of day.
Water temp by month
Monthly average max / min water temperatures
The graph below shows the range of monthly North Sunderland water temperature derived from many years of historical sea surface temperature data.
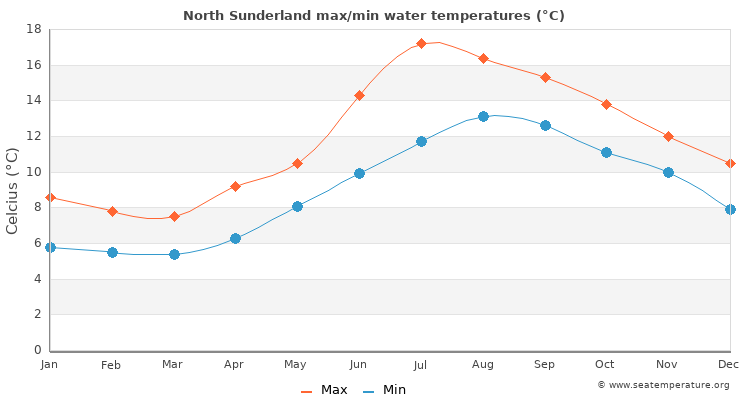
| Jan | Feb | Mar | Apr | May | Jun | Jul | Aug | Sep | Oct | Nov | Dec | |
|---|---|---|---|---|---|---|---|---|---|---|---|---|
| Min °C | 5.8 | 5.5 | 5.4 | 6.3 | 8.1 | 9.9 | 11.7 | 13.1 | 12.6 | 11.1 | 10 | 7.9 |
| Max °C | 8.6 | 7.8 | 7.5 | 9.2 | 10.5 | 14.3 | 17.2 | 16.4 | 15.3 | 13.8 | 12 | 10.5 |
| Min °F | 43.6 | 42.8 | 42.5 | 44.5 | 47.5 | 51.6 | 55.2 | 56.9 | 55.7 | 53 | 50.8 | 47.3 |
| Max °F | 46.4 | 45.1 | 44.6 | 47.4 | 49.9 | 56 | 60.7 | 60.2 | 58.4 | 55.7 | 52.8 | 49.9 |
The warmest water temperature is in August with an average around 58.5°F / 14.7°C. The coldest month is March with an average water temperature of 43.5°F / 6.4°C.
7 day tide forecast for North Sunderland
| Sat | Sun | Mon | Tue | Wed | Thu | Fri |
|---|---|---|---|---|---|---|
|
|
|
|
|
|
|
*These tide times are estimates based on the nearest accurate location (Northshields, England) and may differ by up to half an hour depending on distance. Please note, the tide times given are not suitable for navigational purposes.