Erskine Water Temperature
(Today) 2025
The water will feel tepid. Swimming will be tolerable without a wetsuit, although it will take a little getting used to. If you intend to stay in the water for a while a 3/2mm wetsuit will be ideal.
Current weather
(clear sky)

The measurements for the water temperature in Erskine, Western Australia are provided by the daily satellite readings provided by the NOAA. The temperatures given are the sea surface temperature (SST) which is most relevant to recreational users.
*Live data may vary from satellite readings for a number of reasons. These include local factors, depth of smapling and time of day.
Water temp by month
Monthly average max / min water temperatures
The graph below shows the range of monthly Erskine water temperature derived from many years of historical sea surface temperature data.
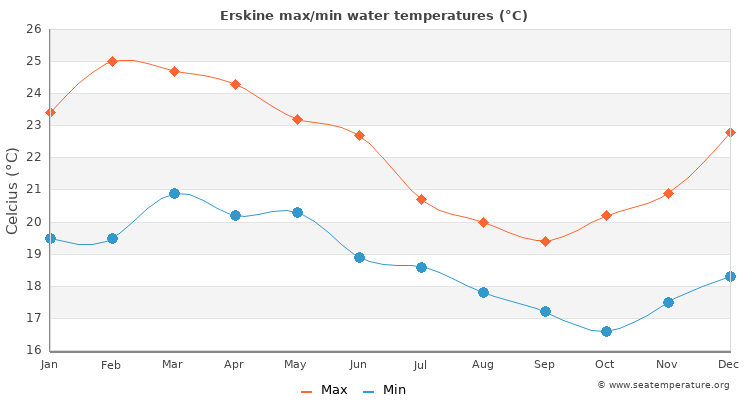
| Jan | Feb | Mar | Apr | May | Jun | Jul | Aug | Sep | Oct | Nov | Dec | |
|---|---|---|---|---|---|---|---|---|---|---|---|---|
| Min °C | 19.5 | 19.5 | 20.9 | 20.2 | 20.3 | 18.9 | 18.6 | 17.8 | 17.2 | 16.6 | 17.5 | 18.3 |
| Max °C | 23.4 | 25 | 24.7 | 24.3 | 23.2 | 22.7 | 20.7 | 20 | 19.4 | 20.2 | 20.9 | 22.8 |
| Min °F | 68.6 | 69.3 | 71.1 | 70 | 69.7 | 67.5 | 66.3 | 64.9 | 63.8 | 63.3 | 64.9 | 66.7 |
| Max °F | 72.5 | 74.8 | 74.9 | 74.1 | 72.6 | 71.3 | 68.4 | 67.1 | 66 | 66.9 | 68.3 | 71.2 |
The warmest water temperature is in March with an average around 73°F / 22.8°C. The coldest month is September with an average water temperature of 64.9°F / 18.3°C.
7 day tide forecast for Erskine
| Thu | Fri | Sat | Sun | Mon | Tue | Wed |
|---|---|---|---|---|---|---|
|
|
|
|
|
|
|
*These tide times are estimates based on the nearest accurate location (Warnbro Sound, Australia) and may differ by up to half an hour depending on distance. Please note, the tide times given are not suitable for navigational purposes.