Qinhuangdao Water Temperature
(Today) 2025
The water will feel very cold. For the hardcore only. The water is now dangerously cold and most people will risk hypothermia if not equipped with a thick, 6/5mm wetsuit along with boots and a hood
Current weather
(broken clouds)

The measurements for the water temperature in Qinhuangdao, Hebei are provided by the daily satellite readings provided by the NOAA. The temperatures given are the sea surface temperature (SST) which is most relevant to recreational users.
*Live data may vary from satellite readings for a number of reasons. These include local factors, depth of smapling and time of day.
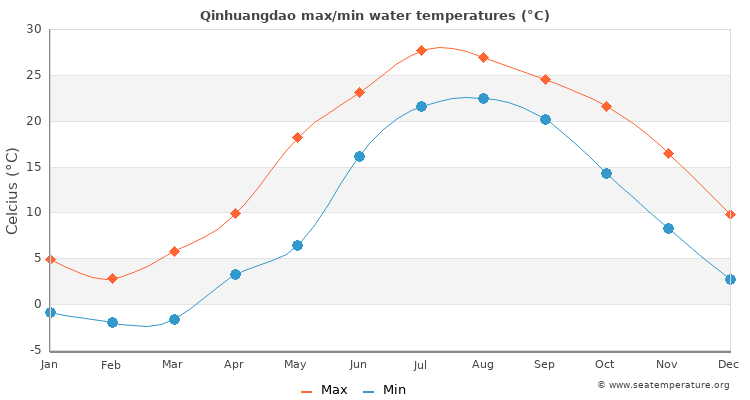
Water temp by month
Monthly average max / min water temperatures
The graph below shows the range of monthly Qinhuangdao water temperature derived from many years of historical sea surface temperature data.
| Jan | Feb | Mar | Apr | May | Jun | Jul | Aug | Sep | Oct | Nov | Dec | |
|---|---|---|---|---|---|---|---|---|---|---|---|---|
| Min °C | -0.9 | -2 | -1.6 | 3.3 | 6.5 | 16.2 | 21.6 | 22.5 | 20.2 | 14.3 | 8.3 | 2.7 |
| Max °C | 4.9 | 2.8 | 5.8 | 9.9 | 18.2 | 23.1 | 27.7 | 27 | 24.5 | 21.6 | 16.5 | 9.8 |
| Min °F | 32.8 | 30.3 | 32.2 | 40.6 | 48.3 | 63.9 | 73.3 | 74.3 | 70 | 60.6 | 50.2 | 39.7 |
| Max °F | 38.5 | 35.1 | 39.5 | 47.2 | 60 | 70.8 | 79.4 | 78.8 | 74.3 | 67.9 | 58.4 | 46.8 |
The warmest water temperature is in August with an average around 76.5°F / 24.7°C. The coldest month is February with an average water temperature of 32.7°F / 0.4°C.
7 day tide forecast for Qinhuangdao
| Fri | Sat | Sun | Mon | Tue | Wed | Thu |
|---|---|---|---|---|---|---|
|
|
|
|
|
|
|
*These tide times are estimates based on the nearest accurate location (Lushun, China) and may differ by up to half an hour depending on distance. Please note, the tide times given are not suitable for navigational purposes.