Langebaan Water Temperature
(Today) 2024
The water will feel cool (fresh). Probably too cold for all but seasoned swimmers. We'd recommend a 4mm or 5mm wetsuit if you want to stay in the water.
Current weather
(overcast clouds)

The measurements for the water temperature in Langebaan, Western Cape are provided by the daily satellite readings provided by the NOAA. The temperatures given are the sea surface temperature (SST) which is most relevant to recreational users.
Water temp by month
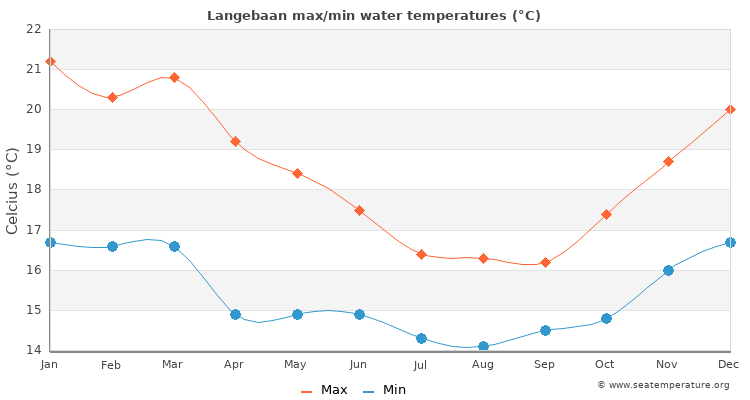
Monthly average max / min water temperatures
The graph below shows the range of monthly Langebaan water temperature derived from many years of historical sea surface temperature data.
| Jan | Feb | Mar | Apr | May | Jun | Jul | Aug | Sep | Oct | Nov | Dec | |
|---|---|---|---|---|---|---|---|---|---|---|---|---|
| Min °C | 16.6 | 16.6 | 16.4 | 15 | 15.1 | 15.2 | 14.2 | 14 | 14.5 | 14.8 | 15.9 | 16.5 |
| Max °C | 21.3 | 20.6 | 21.2 | 19.7 | 18.8 | 17.5 | 16.7 | 16.9 | 16.6 | 17.5 | 18.6 | 19.9 |
| Min °F | 63.7 | 63.5 | 63.4 | 60.8 | 60.6 | 60.2 | 58.5 | 58.3 | 58.9 | 59.7 | 61.7 | 63.1 |
| Max °F | 68.4 | 67.5 | 68.2 | 65.5 | 64.3 | 62.5 | 61 | 61.2 | 61 | 62.4 | 64.4 | 66.5 |
The warmest water temperature is in January with an average around 66°F / 18.9°C. The coldest month is July with an average water temperature of 59.7°F / 15.4°C.
7 day tide forecast for Langebaan
| Sat | Sun | Mon | Tue | Wed | Thu | Fri |
|---|---|---|---|---|---|---|
|
|
|
|
|
|
|
*These tide times are estimates based on the nearest accurate location (Cape Town, South Africa) and may differ by up to half an hour depending on distance. Please note, the tide times given are not suitable for navigational purposes.